
Drifting Into My Lane
Accidents happen, I am pretty sure we have all checked our phone, sipped coffee, or maybe applied make-up and starting drifting into another lane. Obviously not safe or recommended when driving…and when it comes to DATA the outcome can be just as disastrous.
I want to share more on the concept of “Data Drift”. If you have ever worked with me or heard me speak, you know that I equate data to the Chaos Theory or Entropy, your phone gets slower, the universe moves towards disorder, our laptop runs out of memory, and machine learning models deteriorate over time.
Like the second law of thermodynamics says, over time, things tend towards disaster. In the world of machine learning (ML), this translates to the event in which a model’s predictive power worsens over time.
It is highly likely that your data is not static. If your data and the model were static then you would not lose performance because the data we are predicting comes from the same distribution as the data used for training. However, if you live in the world of transactions, changes, and dynamic data, than your evolving data like financial transactions, weather patterns, sensor data, mobile exchanges, and many other variables beyond your control…than the performance of the model changes too.
Over time, ML models lose predictive power, this is “model drift” and is a phenomenon that creeps in as time goes by. Unfortunately, it goes undetected and has serious and sometimes disastrous consequences. I don’t want to get too deep into model drift but want to focus on one of the two aspects that lead to it’s occurrence. The idea of concept drift and data drift in order to share what is happening and how we can help overcome their effects.
Concept drift
According to the literature, concept drift is the phenomenon where the statistical properties of the class variable — in other words, the target we want to predict — change over time. When a model is trained, it knows a function that maps the independent variables, or predictors, to the target variables. In a static and perfect environment where none of these predictors nor the target evolves, the model should perform as it did on day one because there’s no change.
However, in a dynamic setting, not only do the statistical properties of the target variable change but so does its meaning. When this change happens, the mapping found is no longer suitable for the new environment. Let me give you a real world scenario as an example.
Example of Concept Drift – you work for a social app and maintain an anti-spam service. On this app you have one model that uses several ways to predict whether a user is a spammer. You are really good at your job and your model is incredibly accurate. So you keep thwart off all the spammers. You come to your performance review and notice that your model’s predictions and outcomes are radically different. Maybe the spammers gave up? Or could it be the concept and techniques of “spamming” drifted or changed?
You trained the model with the premise that sending more than eight messages in a minute had to be a spammer. But as emojis and other features on the app changed and the app user base grew…many users started sending more than eight messages a minute and group messaging became popular. So, the original idea you and the model had about what it means to be a spammer has changed, and now sending eight messages in a minute becomes normal and not something that only spammers do. In other words, the concept of spammers has drifted.
Data Drift
While concept drift is about the target variable, there’s another phenomenon, named data drift, that describes the change of the properties of the independent variables. In this case, it is not the definition of a spammer that changes, but the values of the features we are using to define them.
For instance, suppose that as a result of the previous concept drift (and the app’s popularity), there’s an update that increases the limit of messages per minute from 20 to 60. Now, because of this change, both spammers and non-spammers get very chatty and are sending a higher number of messages. Before, when we trained the model using the data from the previous app version, it learned that a user who sends more than 8 messages in a minute is a spammer. So now, it will go crazy and classify everybody as a spammer (a nightmare scenario) because the feature’s distribution has changed, or drifted.
Data drift is also caused by unexpected events we can’t control. For example, suppose that your model is doing so well and catching so many spammers that at some point, they change their spamming behavior to try to fool the model. In this case, instead of producing false positives, we’ll have more false negatives because the model doesn’t know the new conditions.
How can we detect these drifts? Since both drifts involve a statistical change in the data, the best approach to detect them is by monitoring its statistical properties, the model’s predictions, and their correlation with other factors.
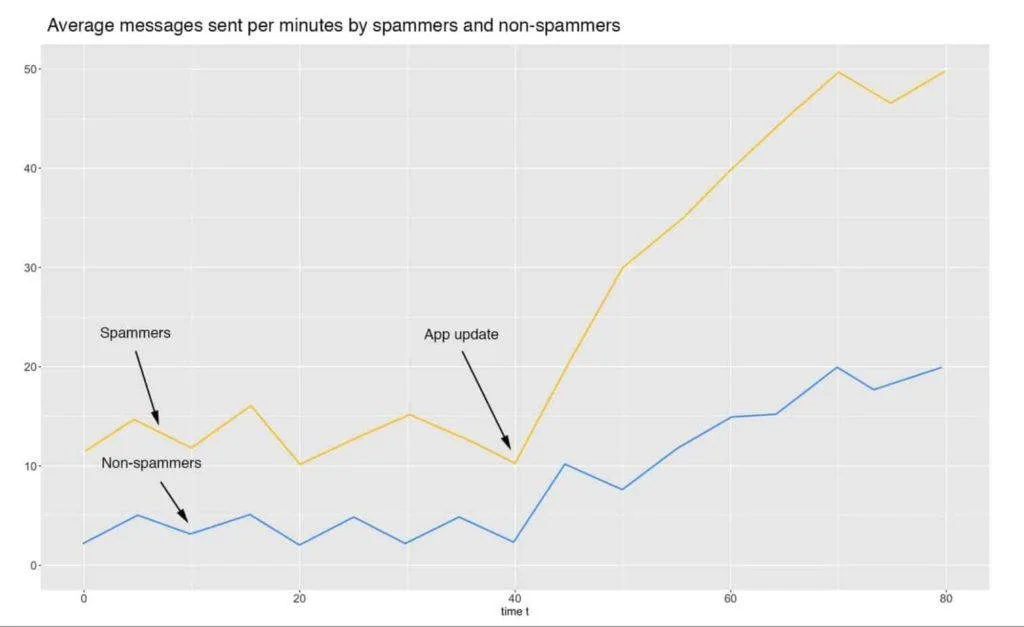
For example, you could deploy dashboards that plot the statistical properties to see how they change over time. Going back to our “messages per minute” and app update example, a plot of the average messages sent by spammers and non-spammers, before and after the update could look like this:
Another thing we could monitor is the outcome of the prediction alongside other data like its correlation to the number of active users. For example, if the number of spammers increase or decrease at a rate very different than that of the active users, there might be something going on. Note that an issue like this doesn’t necessarily mean drift. There could be other phenomena like spam waves or seasonality changes (spammers celebrate holidays, too) that could cause such variation in the data.
Who is best to solve the problem? While trying to account for all these variables and changes, who is the best person to ask about user behavior? Engineers or the team charged with running the app and creating more user engagement?
How To Overcome Drift
This is why we designed Inonde. We wanted to empower the people closest to the data, closest to the problem, and most intimately familiar with what was or is happening in the environment. Inonde allows these Subject Matter Experts to apply logic, structure, and create models without scripting or coding.
We also wanted to capture and automate the complex scripts and code being written by Data Scientists and Engineers so their efforts could be accelerated and shared to enable data process automation (DPA).
When a model is created up front by the people who understand the data, the model is tailored and knows the function that maps the inputs to a label. But when it experiences concept drift, the meaning behind this label changes. In some way, we could think of this as if the model’s decision boundary (what is learned) also changed. For instance, the next image shows a trained model with its decision boundary.
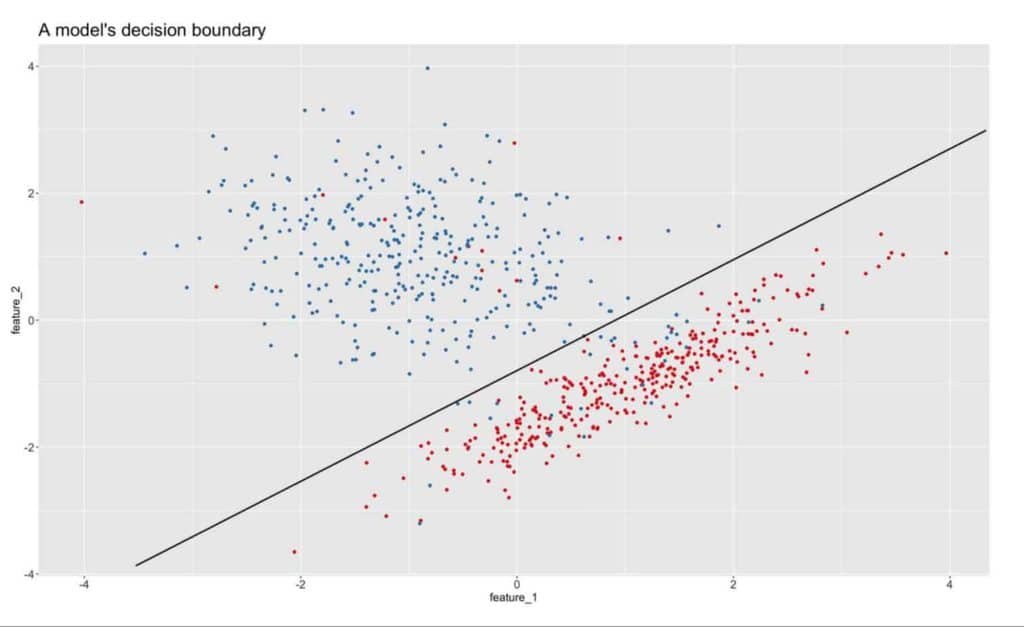
It would appear we are on track. On one side of the line, we have the class “spam” in red and on the other side of the line we have a class “no-spam” in blue. Now, let’s fast forward over time and see how the model being applied begins to show signs of concept drift. The next image demonstrates the result of “drift”.
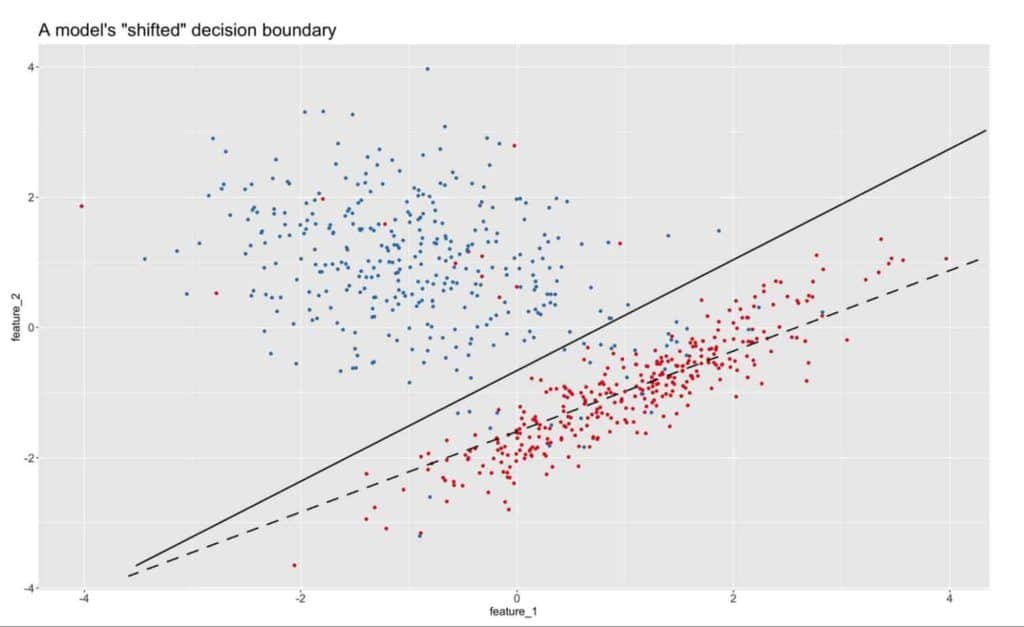
Here is the same model after time has passed and the “new” and clearly skewed decision boundary.
What is the best way to reduce or eliminate drift? TRAINING. And the best people to train the model are the ones that are least likely to have the engineering skills or scientific background.
So Inonde helps the industry experts apply their vast depth and breath of the topic and understanding of the dynamics in the data to re-train the model and capture this in a way to build templates for automation.
Recap
Over time, all things “drift” and most things begin to slow down or move toward chaos and machine learning models lose their predictive power — a concept known as model drifting. We provided a visualization to demonstrate the shifting using a decision boundary as an example, and how it might look in a dashboard and the way to overcome this effect through training.
The most important thing is knowing your data and empowering the highest number of people to be able to engage and protect the data from drift.